
Analytics & reporting

See the work, the exceptions and the response.

Give each role a focused operating view while leadership follows performance, risk and closure across sites, facilities and operating teams.

Role-aware dashboards

Move from totals to the next decision.

IMS combines performance indicators with actionable queues so users can open the underlying record instead of stopping at a chart.

Operator

Today, upcoming and overdue

Assigned rounds, pending results, completion trends and personal work history.

Supervisor

Review and performance

Approval queues, top areas, operator activity, status distribution and processing time.

Mitigation

Corrective-action workload

Assigned, in-progress, completed, approved and overdue mitigation tasks.

Decision-ready visibility

Move from portfolio totals to the underlying work.

Supervisors can compare review workload, status distribution and the operating areas generating the most activity.
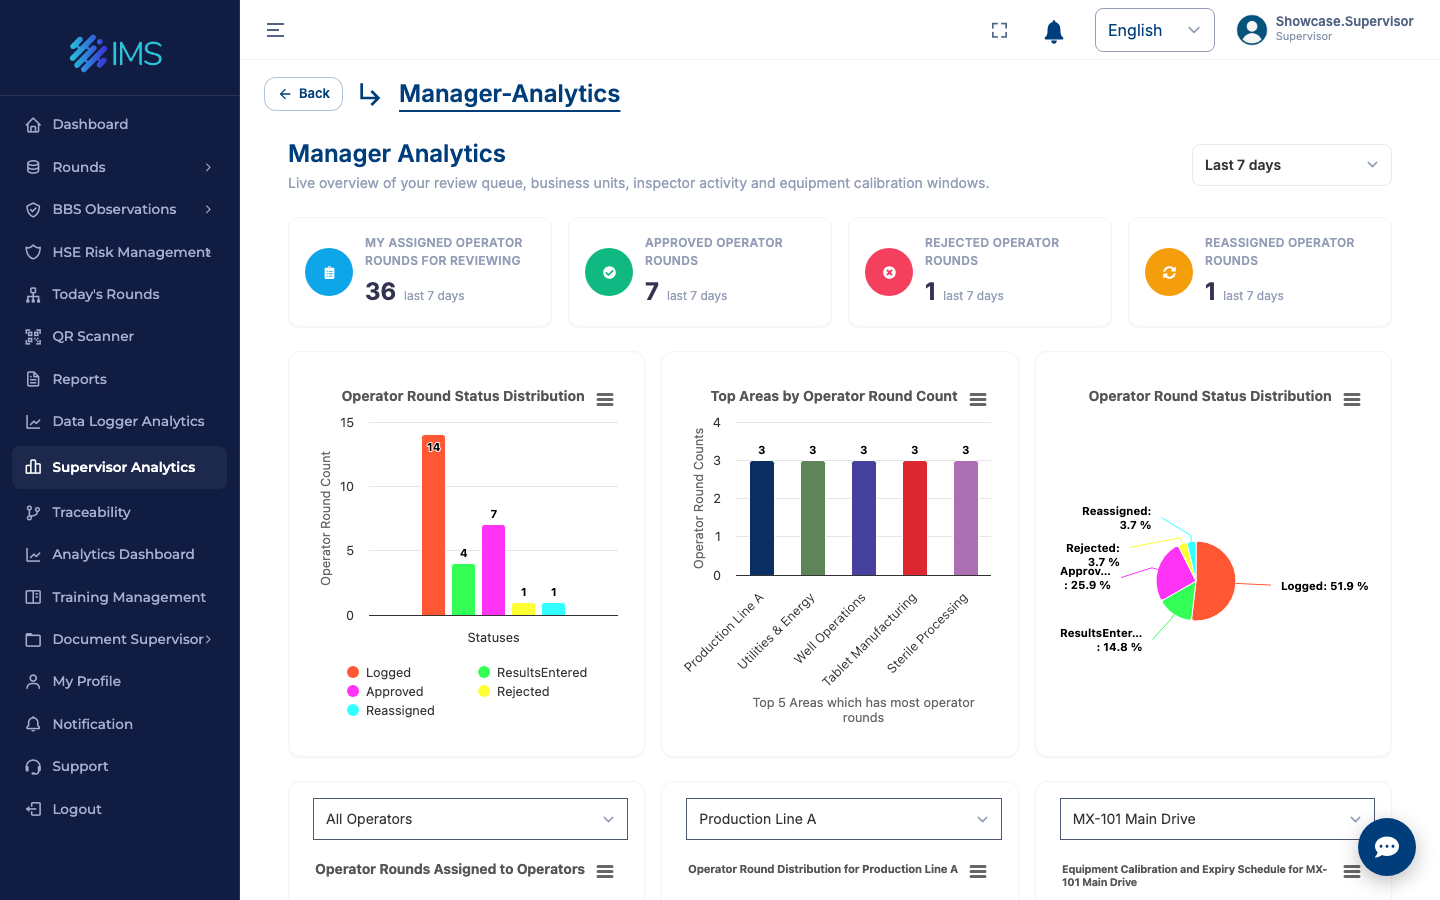
IMS supervisor analytics dashboard with review metrics, round-status charts and top operating areas
Supervisor analytics combines workload, approvals, exceptions and area-level patterns.
Connected operational data

Compare field work with the signals around it.

Use imported data-logger records and IoT sensor readings as operational context while keeping official operator-entered results unchanged.

TemperaturePressureHumidityAQICO₂Equipment trends
  • Time-series trends: filter readings by date, period, device and measurement type.
  • Threshold context: display normal, warning and poor ranges where configured.
  • Imported references: retain the source file and timestamp for logger data.
  • Separate records: reference data does not overwrite the accountable inspection result.
Live operational context

Bring sensor trends into the same operating picture.

Teams can monitor readings from different facilities and compare current conditions with recent time-series behavior.
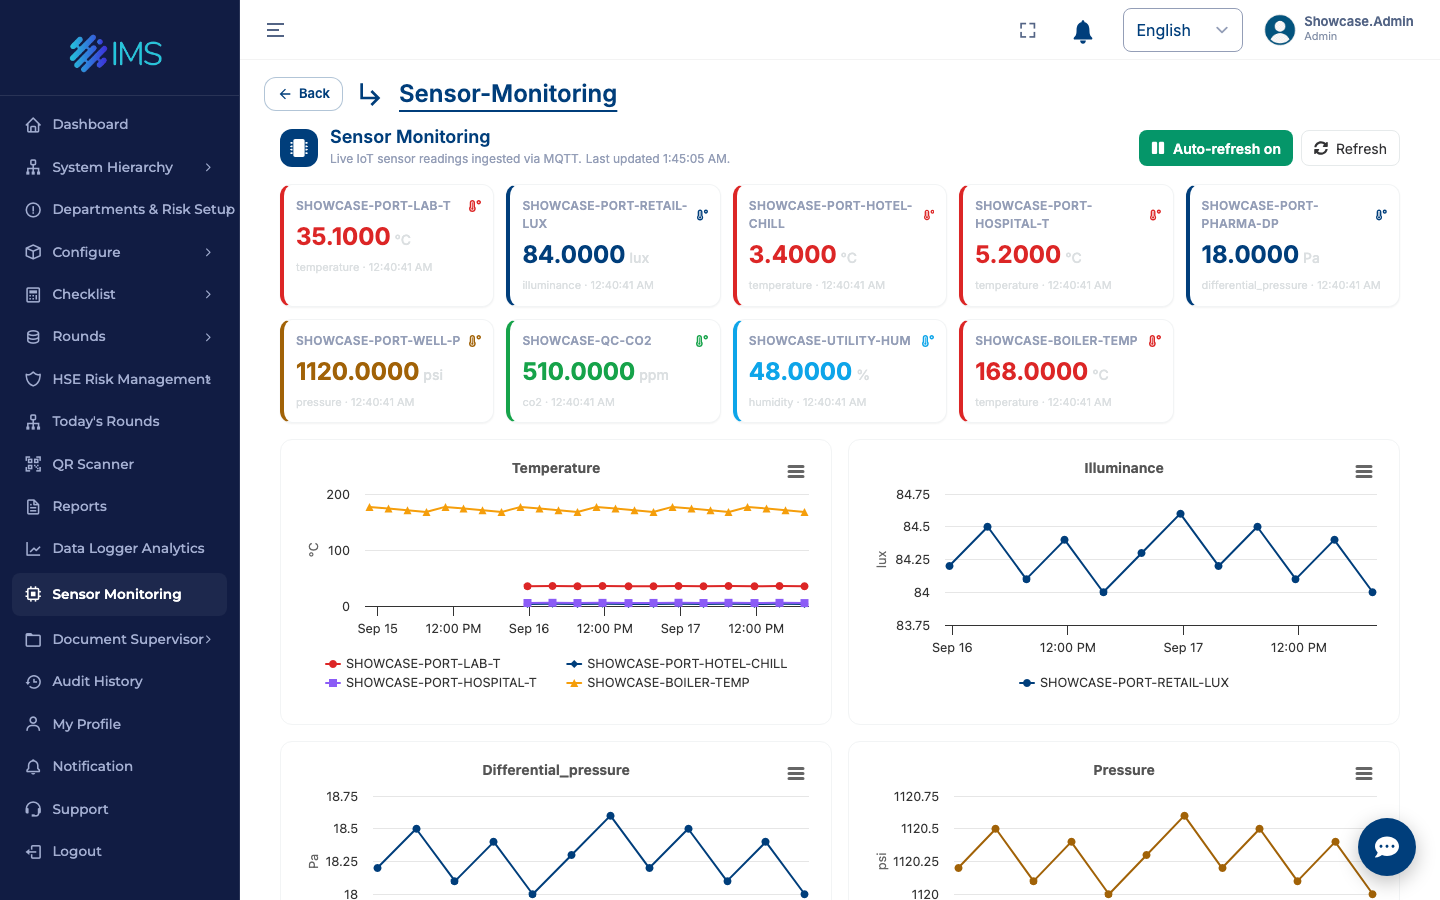
IMS sensor monitoring screen showing live temperature, pressure, humidity, illuminance and carbon-dioxide readings with trend charts
Live sensor cards and historical trends add context without replacing accountable inspection results.
Reports and auditability

Make the evidence usable beyond the dashboard.

Export operational summaries, certificates and lifecycle details for review, follow-up and compliance preparation.

Inspection summariesCompletion and result overview
Equipment reportsAsset-linked operational records
HSE statusRisk and mitigation progress
Traceability timelinePeople, dates and decisions
Traceable decisions

Follow the record, not the paper trail.

Review the status, people and timing behind each inspection, with a connected history of its progress.
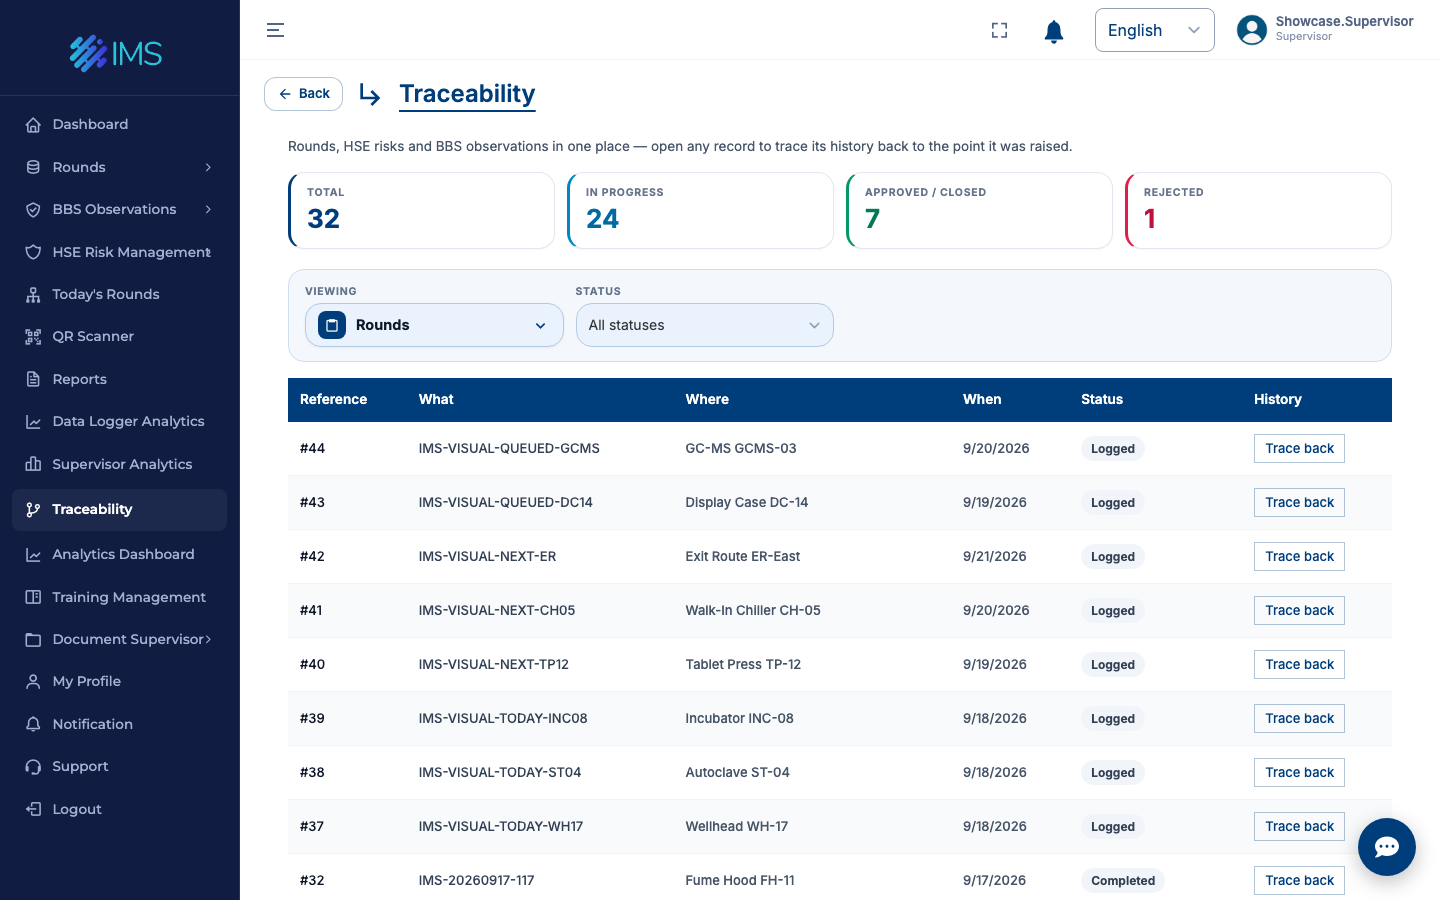
IMS traceability register showing inspection records, approval status, assignees and lifecycle timing
Move from the performance overview to the underlying inspection record.
See it in your operation

Bring operational performance and corrective action into the same review.

See a role-specific demonstration using representative round, risk and mitigation data.

Book a demo